Sunday, 1 September 2013
Thursday, 29 August 2013
USDINR 29 August 2013 : An update
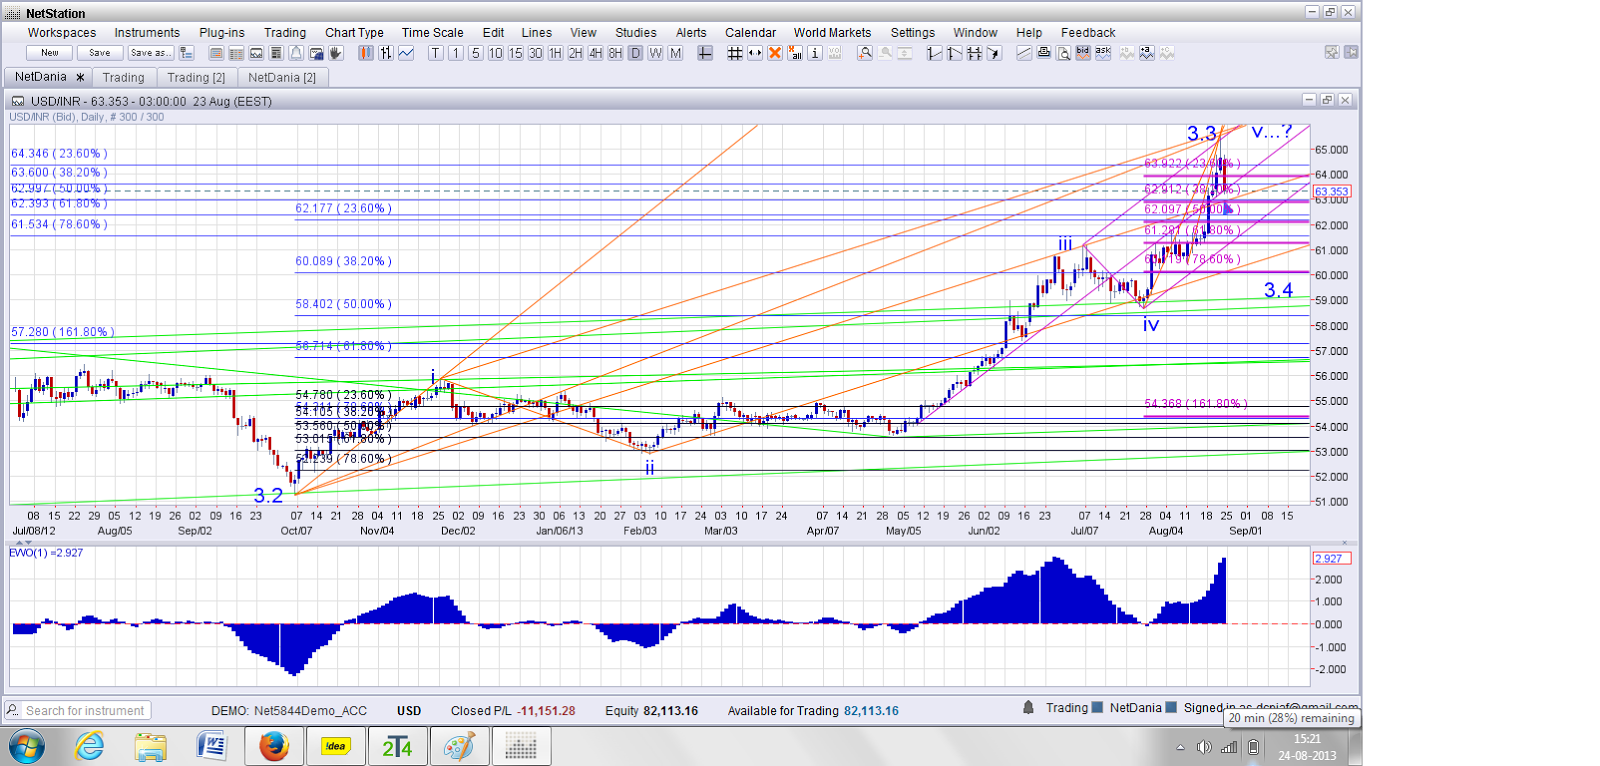
An update on my post USDINR 25 August 2013 : EW Counts Revisited . The chart below says it all. Atleast the immediate moves.
Saturday, 24 August 2013
USDINR 25 August 2013 : EW Counts Revisited
The price action in USDINR far exceeded my perceptions posted at USDINR 12 Aug 2013 : Peaking out and prompted me to revisit the EW setup. A fresh look after seeing data for past 15 years revealed the following:
The larger frame work....

A closer view...

EW counts :
Fractals of III
Fractals of 3
Fractals of (3)
Max 65.9. But if v started from 58.66, it may go upto 59.96 (which should be the basis for SL)
Fractals of v
** In progress
*** Projected.
(iv) may be over, but has scope to go down till 61.905.
(v) should not go over 65.9/65.96 based on count at one degree higher.
(iii) is not yet extended but it would be extended if v started from 58.66. In other possibility, (iii) could be extended with respect to (v), as it remains restricted to 65.9/65.96
Based on these counts, shorts could be initiated above 65.57 with SL of 65.96/66.01 for a target of 60.
The larger frame work....

A closer view...

EW counts :
| I | 39.48 | - | 51.94 | = | -12.46 | ||
| II | 51.94 | - | 43.225 | = | 8.715 | -69.9438 | |
| III | 43.225 | - | 69.5 | = | -26.275 | 210.8748** |
Fractals of III
| 1 | 43.225 | - | 53.74 | = | -10.515 | ||
| 2 | 53.74 | - | 48.57 | = | 5.17 | -49.1679 | |
| 3 | 48.57 | - | 69 | = | -20.43 | 194.2939** |
Fractals of 3
| (1) | 48.57 | - | 57.335 | = | -8.765 | ||
| (2) | 57.335 | - | 51.36 | = | 5.975 | -68.1689 | |
| (3) | 51.36 | - | 65.561 | = | -14.201 | 162.0194** |
Fractals of (3)
| i | 51.365 | - | 55.875 | = | -4.51 | ||
| ii | 55.875 | - | 52.89 | = | 2.985 | -66.1863 | |
| iii | 52.89 | - | 61.53 | = | -8.64 | 191.5743 | |
| iv | 61.53 | - | 58.6 | = | 2.93 | -33.912 | |
| v | 58.6 | - | 65.57 | = | -6.97 | 154.5455** |
Max 65.9. But if v started from 58.66, it may go upto 59.96 (which should be the basis for SL)
Fractals of v
| (i) | 58.6 | - | 61.905 | = | -3.305 | ||
| (ii) | 61.905 | - | 60.245 | = | 1.66 | -50.2269 | |
| (iii) | 60.245 | - | 65.561 | = | -5.316 | 160.8472 | |
| (iv) | 65.561 | - | 63.206 | = | 2.355 | -44.3002** | |
| (v) | 63.206 | - | 65.89 | = | -2.684 | 81.21029*** |
** In progress
*** Projected.
(iv) may be over, but has scope to go down till 61.905.
(v) should not go over 65.9/65.96 based on count at one degree higher.
(iii) is not yet extended but it would be extended if v started from 58.66. In other possibility, (iii) could be extended with respect to (v), as it remains restricted to 65.9/65.96
Based on these counts, shorts could be initiated above 65.57 with SL of 65.96/66.01 for a target of 60.
Monday, 12 August 2013
USDINR 12 Aug 2013 : Peaking out
I had posted my last detailed post on USDINR at USDINR 10 July 2013 : Gets complicated and a short update on the likely EW counts at USDINR 01 August 2013 : The most preferred EW count. The moves so far continue to remain within expected alternates. The chart below is an update of how it looks for USDINR as on 12 August 2013.
This chart has guided me so far in the longer term for past six months or more and it still continues to remain the biggest influence on how I think about USDINR. The chart shows an APF in red and two SFFs in blue and purple. The reference points are shown in circles of respective colors. Some important resistance/supports within an object are shown with triangles of same color. Presently I expect the price action to remain within UTLs of blue and purple SFFs. A breach back of purple UTL needs to occur for any substantial correction or a fall below previous low. The EW count so far remain as
Trade Setup - Longs near 58 and shorts near 62.2 can be initiated as and when they are reached for targets to blue and purple UTLs respectively. SLs can be suitably taken beyond the respective TLs.
This chart has guided me so far in the longer term for past six months or more and it still continues to remain the biggest influence on how I think about USDINR. The chart shows an APF in red and two SFFs in blue and purple. The reference points are shown in circles of respective colors. Some important resistance/supports within an object are shown with triangles of same color. Presently I expect the price action to remain within UTLs of blue and purple SFFs. A breach back of purple UTL needs to occur for any substantial correction or a fall below previous low. The EW count so far remain as
| 1 | 51.365 | - | 55.875 | = | -4.51 | ||
| 2 | 55.875 | - | 52.89 | = | 2.985 | -66.1863 | |
| 3 | 52.89 | - | 61.905 | = | -9.015 | 199.8891 | |
| 4 | 61.905 | - | 58.46 | = | 3.445 | -38.2141 | |
| 5 | 58.46 | - | 62.97 | = | -4.51 | 100 |
Trade Setup - Longs near 58 and shorts near 62.2 can be initiated as and when they are reached for targets to blue and purple UTLs respectively. SLs can be suitably taken beyond the respective TLs.
Wednesday, 31 July 2013
USDINR 01 August 2013 : The most preferred EW count
This is what I am getting convinced at :
| 1 | 51.365 | - | 55.875 | = | -4.51 | ||
| 2 | 55.875 | - | 52.89 | = | 2.985 | -66.1863 | |
| 3 | 52.89 | - | 61.908 | = | -9.018 | 199.9557 | |
| 4 | 61.908 | - | 58.46 | = | 3.448 | -38.2346 | |
| 5 | 58.46 | - | 62.97 | = | -4.51 | 100 |
| T1= | 62.48743 | , T2= | 62.97 | , T3= | 64.97557 |
Monday, 22 July 2013
Wednesday, 10 July 2013
USDINR 10 July 2013 : Gets complicated.
LTL of Black APF is crucial. If held, a new rise may be seen.
MT APFs
A closer look on the chart above indicates that Blue APF is breached and needs to be regained, which may happen due to support of Black LTL. If sustains below Blue LTL, the purple APF will come into focus.
ST APFs
Short term APFs also show that a crucial support zone was breached, which would be bearish if sustained. Blue LTL remains the key for now.
EW
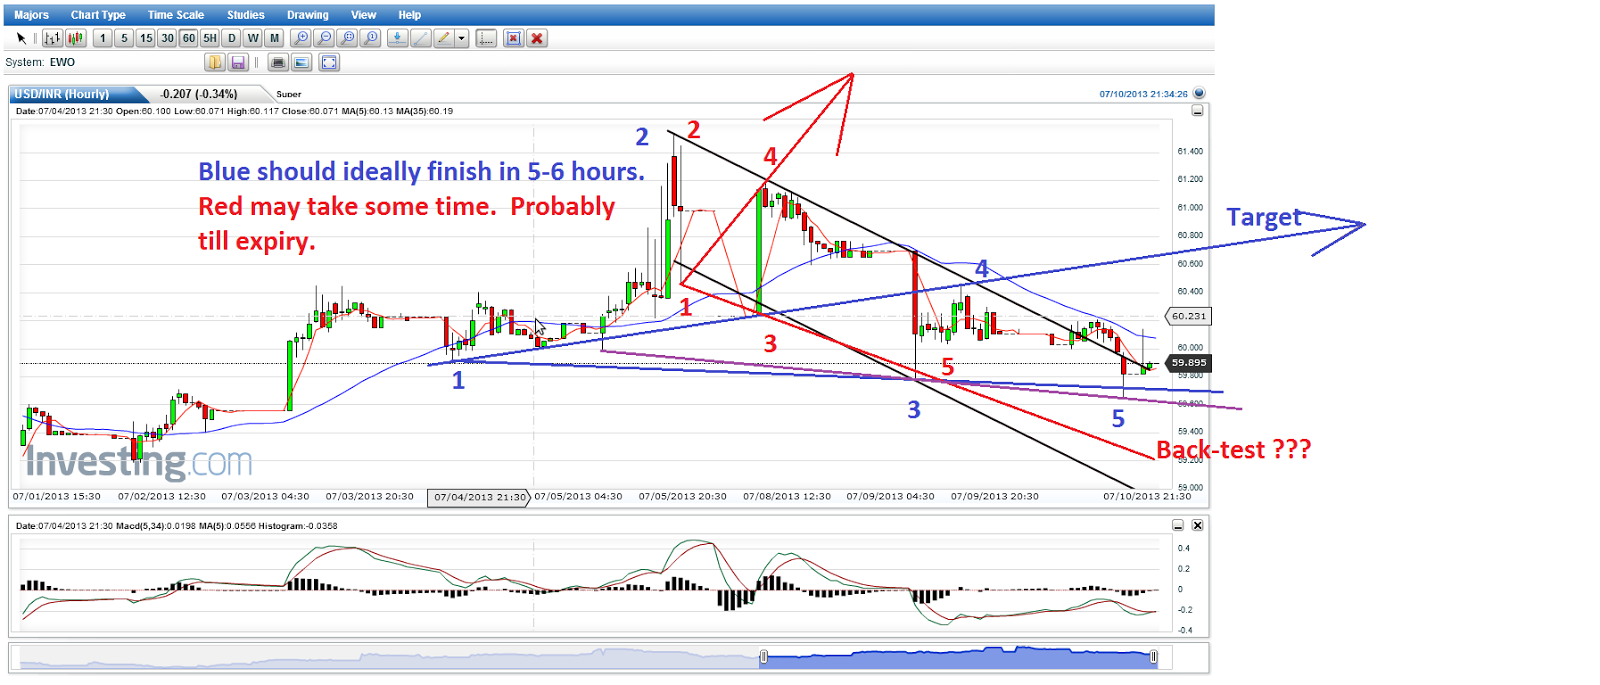
EW has many alternates at this juncture and they all remain valid. The correction reached 24% today, which leaves the gates open for a rise provided the breach is sustained. Various possibilities are in the chart below:
ST Channel
The black UTL needs to be watched for an upward breach. The presence of a positive divergence on hourly chart should also suggest that the bears should be cautious.
Wolfe Wave
I can figure out 3 bullish Wolfe waves in the short term. The conservative WW targets 60.6+ and the aggressive may take a faster and steeper route for targets in excess of 65.
EW Counts
| Fractals of 3 | |||||||
| i | 52.89 | - | 55.14 | = | -2.25 | ||
| ii | 55.14 | - | 53.64 | = | 1.5 | -66.6667 | |
| iii | 53.64 | - | 61.535 | = | -7.895 | 350.8889 | |
| iv | 61.535 | - | 59.645 | = | 1.89 | -23.9392 | |
| v | 59.645 | - | 61.895 | = | -2.25 | 100 | |
| - | 28.49905 | ||||||
| T1= | 62.94739 | , T2= | 61.895 | , T3= | 64.98761 | ||
Trade Setup
.
Short below 59.8 with SL 60 for target 58.5.
Long above 59.9 with SL 59.6 (or between 58.5-58.3 with SL 57.4) for target of 60.6, 61.2 and possibly 61.9, 62.95 and 65.
Subscribe to:
Posts (Atom)