The price action in USDINR far exceeded my perceptions posted at
USDINR 12 Aug 2013 : Peaking out and prompted me to revisit the EW setup. A fresh look after seeing data for past 15 years revealed the following:
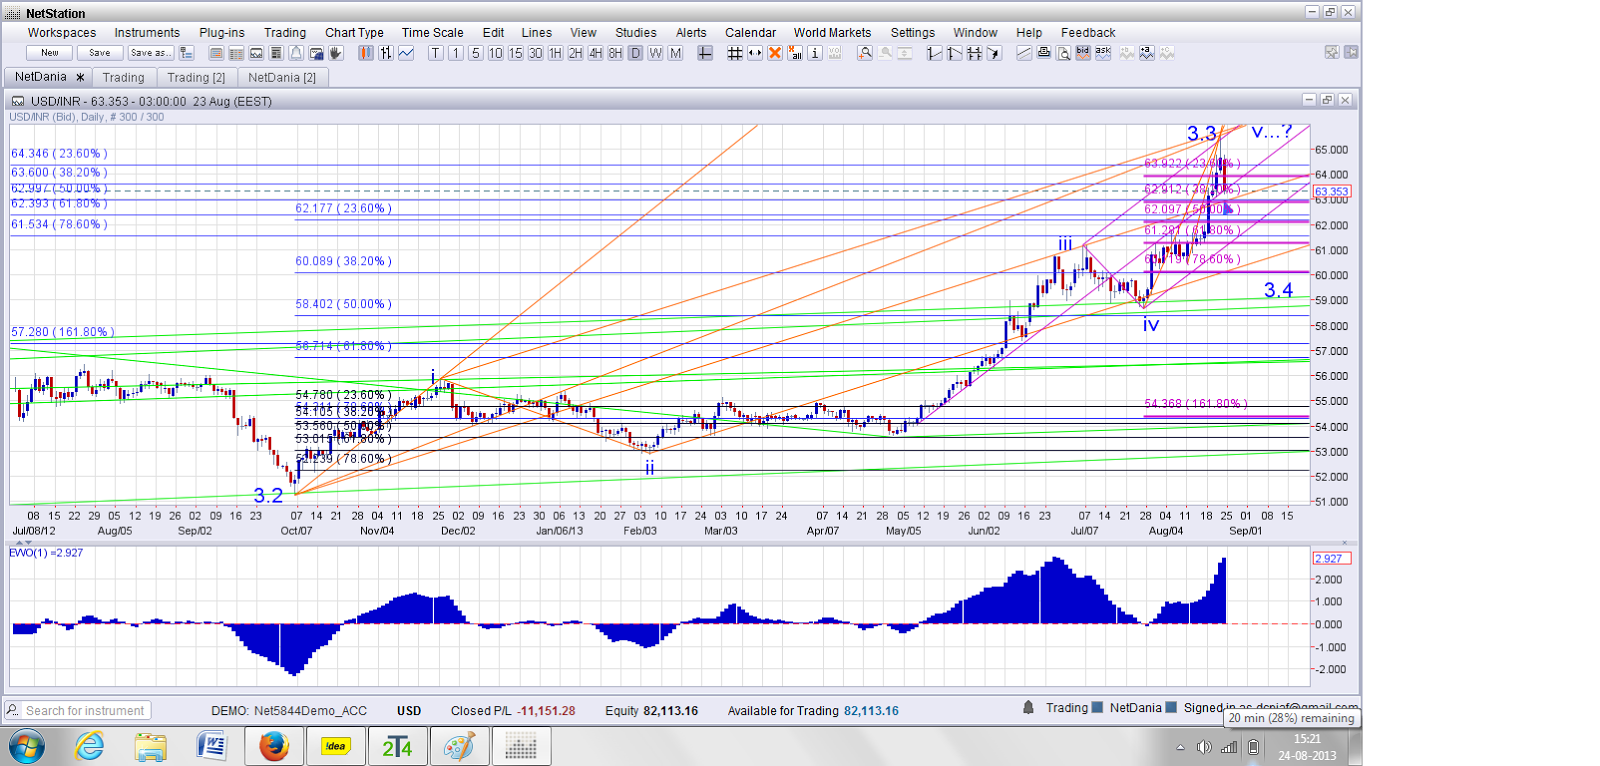
The larger frame work....
 A closer view...
 EW counts :
| I |
39.48 |
- |
51.94 |
= |
-12.46 |
|
|
| II |
51.94 |
- |
43.225 |
= |
8.715 |
|
-69.9438 |
| III |
43.225 |
- |
69.5 |
= |
-26.275 |
|
210.8748** |
Fractals of III
| 1 |
43.225 |
- |
53.74 |
= |
-10.515 |
|
|
| 2 |
53.74 |
- |
48.57 |
= |
5.17 |
|
-49.1679 |
| 3 |
48.57 |
- |
69 |
= |
-20.43 |
|
194.2939** |
Fractals of 3
| (1) |
48.57 |
- |
57.335 |
= |
-8.765 |
|
|
| (2) |
57.335 |
- |
51.36 |
= |
5.975 |
|
-68.1689 |
| (3) |
51.36 |
- |
65.561 |
= |
-14.201 |
|
162.0194** |
Fractals of (3)
| i |
51.365 |
- |
55.875 |
= |
-4.51 |
|
|
| ii |
55.875 |
- |
52.89 |
= |
2.985 |
|
-66.1863 |
| iii |
52.89 |
- |
61.53 |
= |
-8.64 |
|
191.5743 |
| iv |
61.53 |
- |
58.6 |
= |
2.93 |
|
-33.912 |
| v |
58.6 |
- |
65.57 |
= |
-6.97 |
|
154.5455** |
Max 65.9. But if v started from 58.66, it may go upto 59.96 (which should be the basis for SL)
Fractals of v
| (i) |
58.6 |
- |
61.905 |
= |
-3.305 |
|
|
| (ii) |
61.905 |
- |
60.245 |
= |
1.66 |
|
-50.2269 |
| (iii) |
60.245 |
- |
65.561 |
= |
-5.316 |
|
160.8472 |
| (iv) |
65.561 |
- |
63.206 |
= |
2.355 |
|
-44.3002** |
| (v) |
63.206 |
- |
65.89 |
= |
-2.684 |
|
81.21029*** |
** In progress
*** Projected.
(iv) may be over, but has scope to go down till 61.905.
(v) should not go over 65.9/65.96 based on count at one degree higher.
(iii) is not yet extended but it would be extended if v started from 58.66. In other possibility, (iii) could be extended with respect to (v), as it remains restricted to 65.9/65.96
Based on these counts, shorts could be initiated above 65.57 with SL of 65.96/66.01 for a target of 60.